D3 Data Table Graph
An interactive Data Table with 2 types of graphs and inputable table made by D3 library.
D3.js stands for Data-Driven Document, is a JavaScript library for producing dynamic, interactive data visualizations in web browsers.
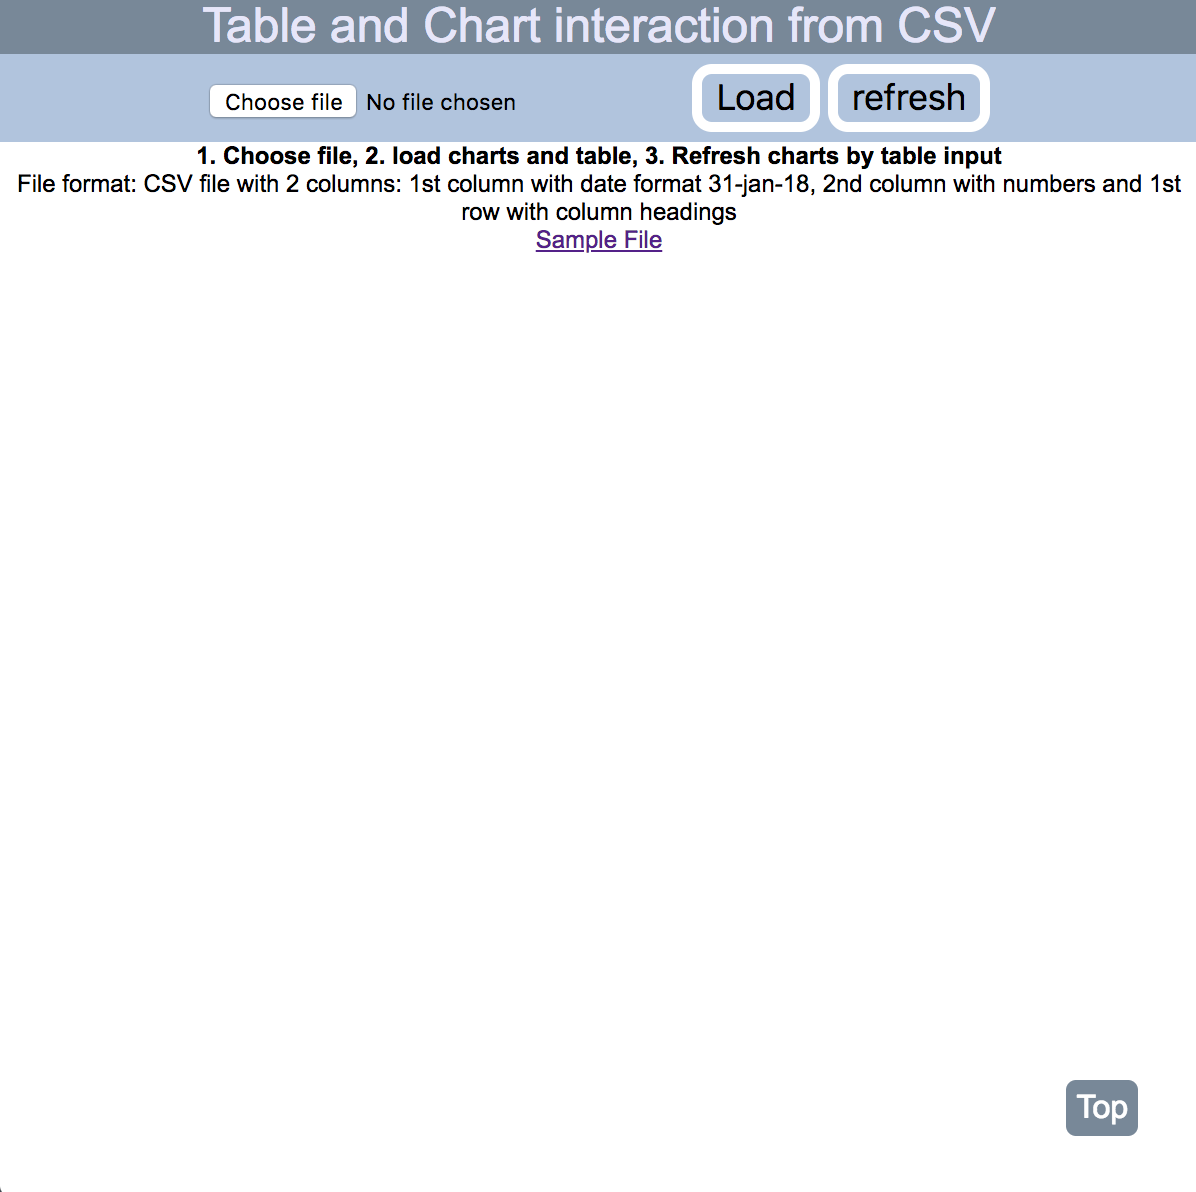
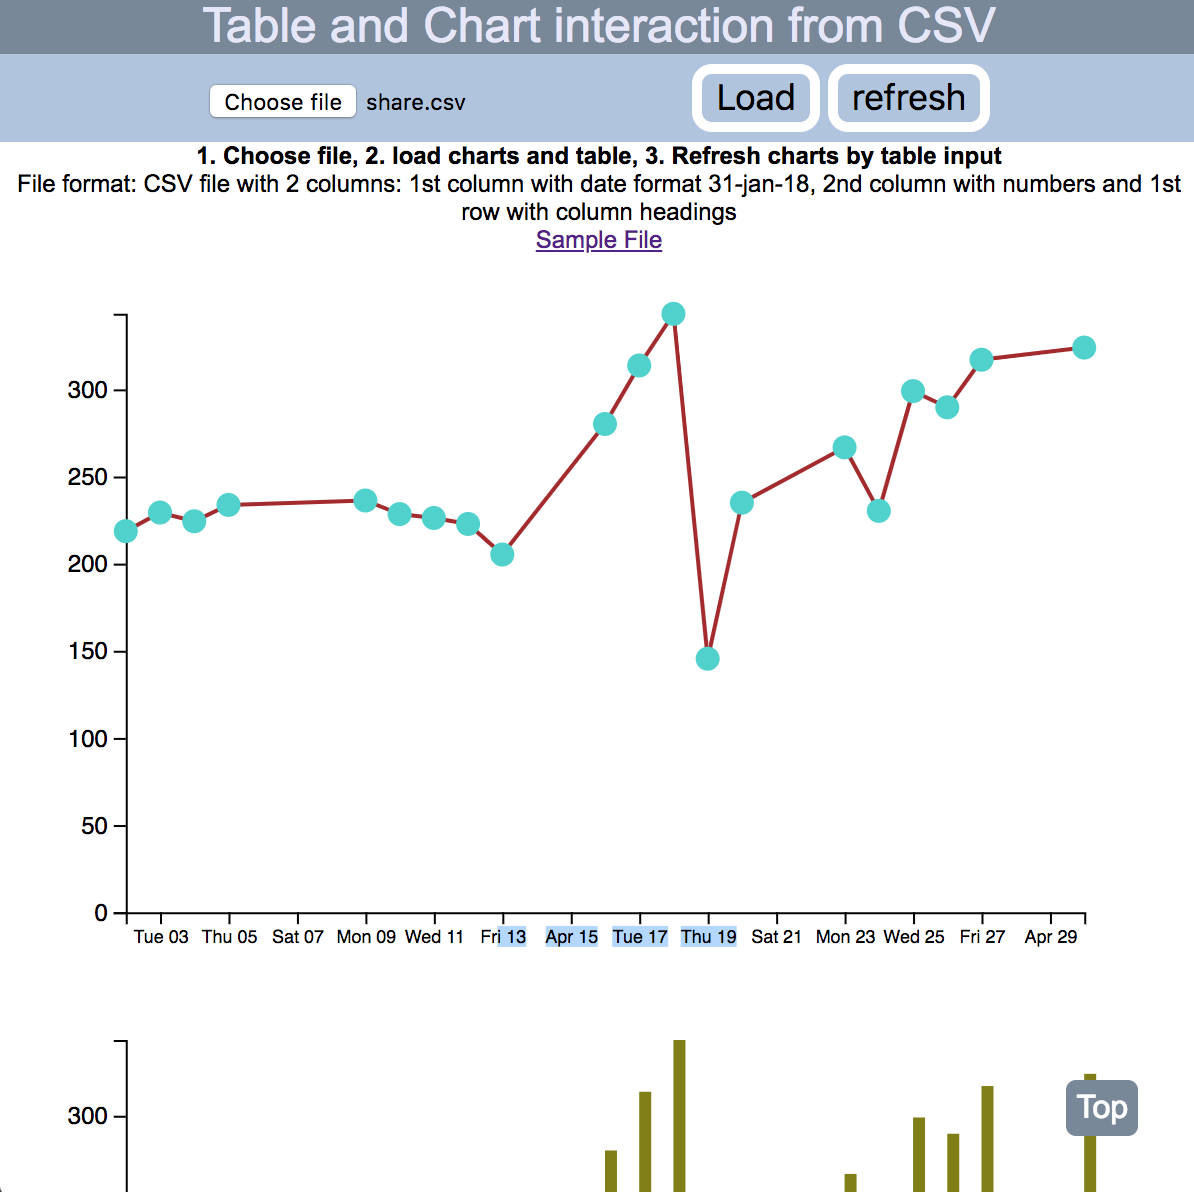
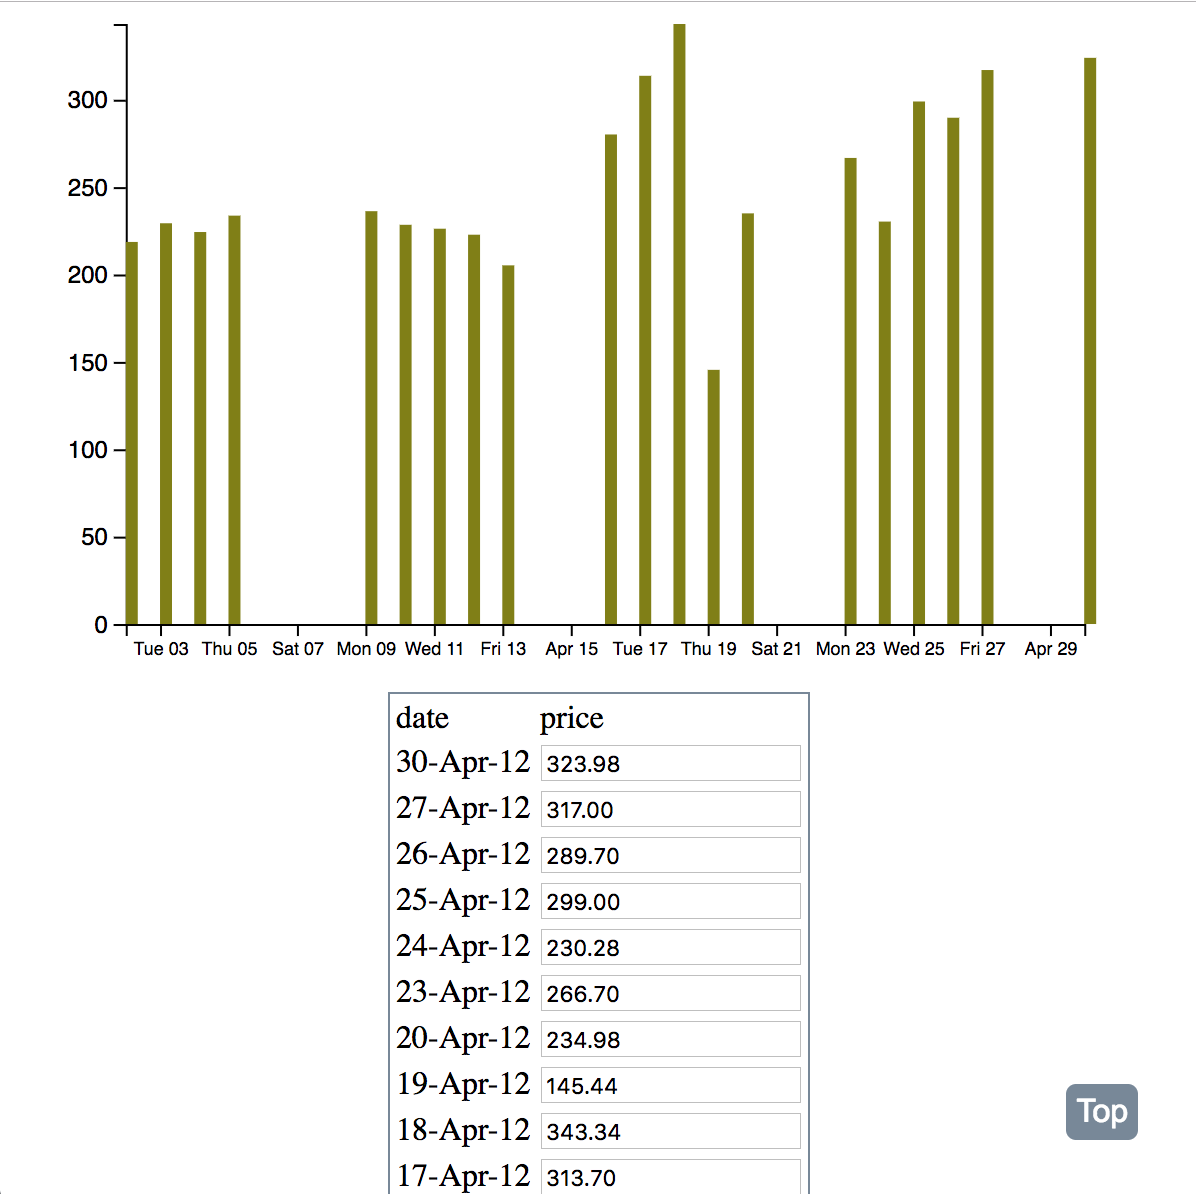
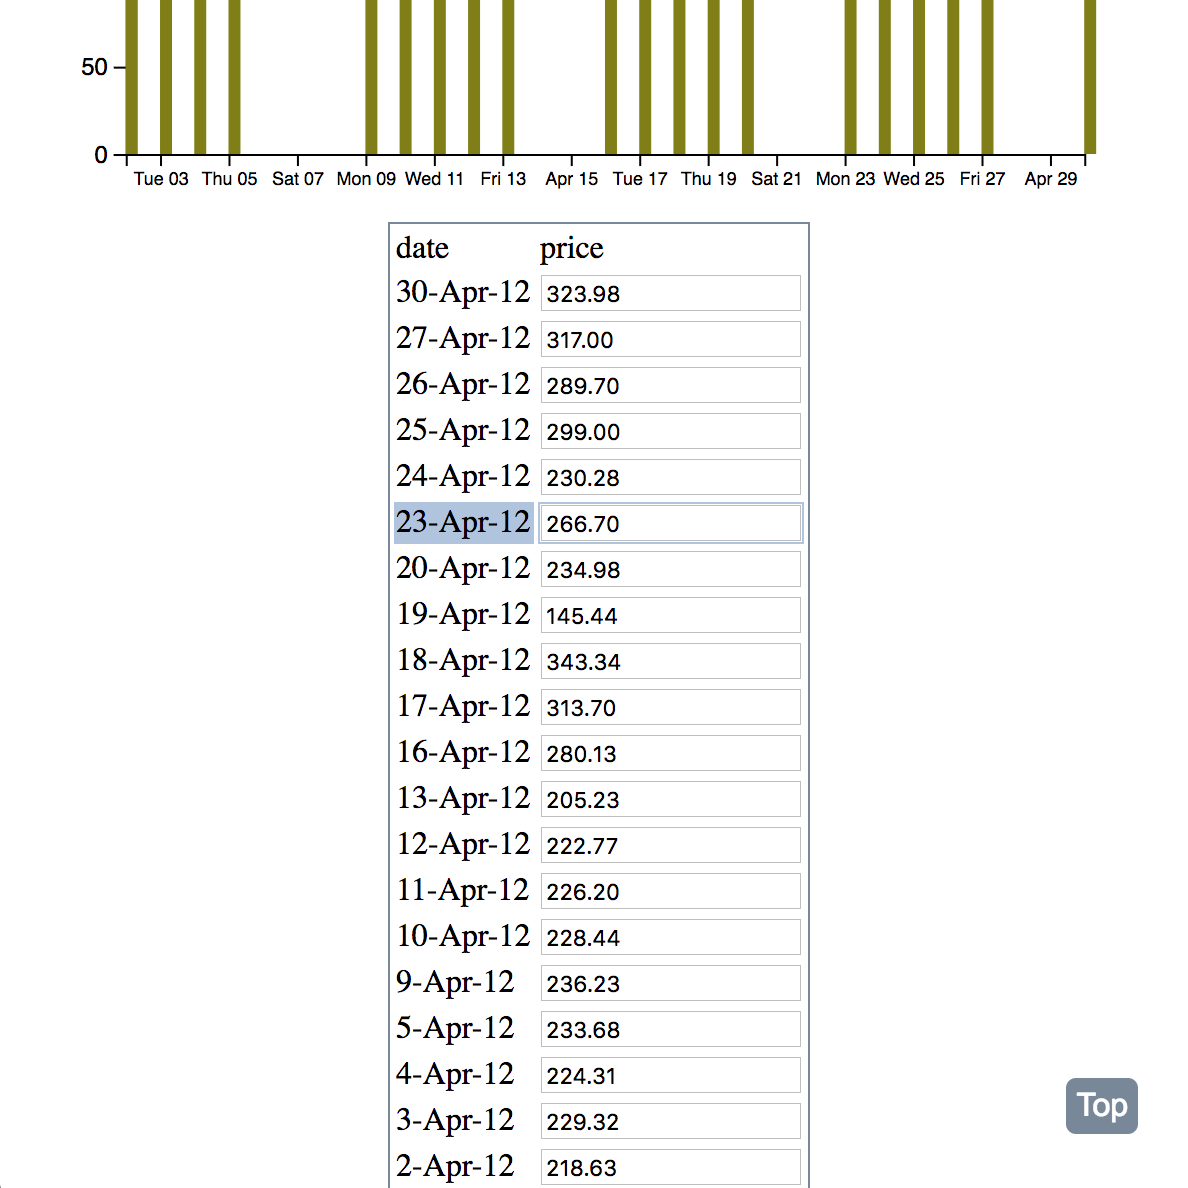
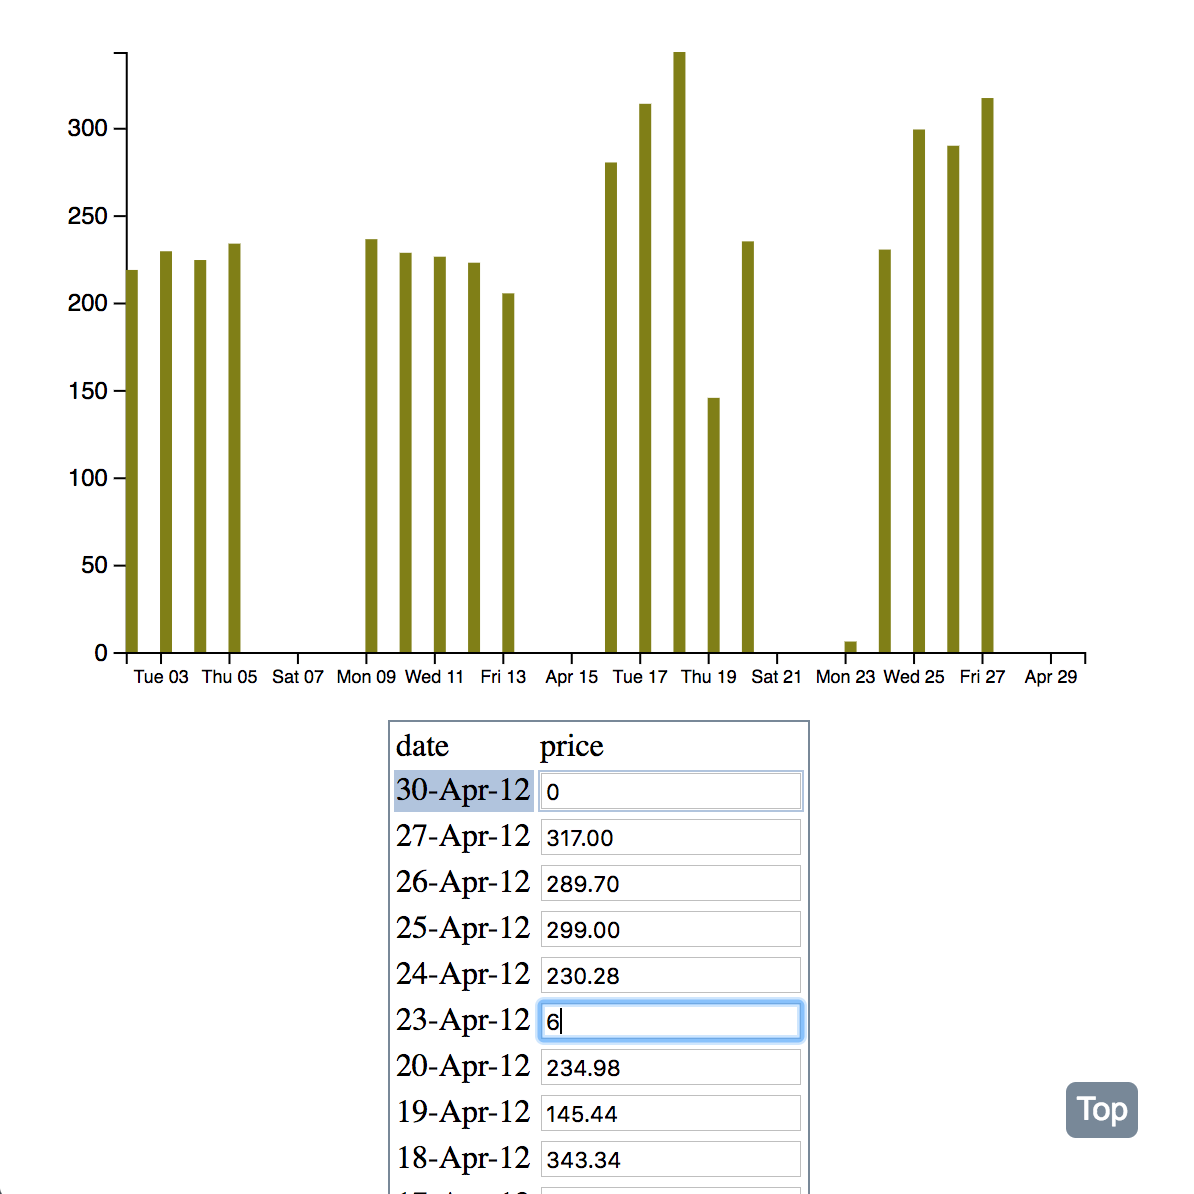
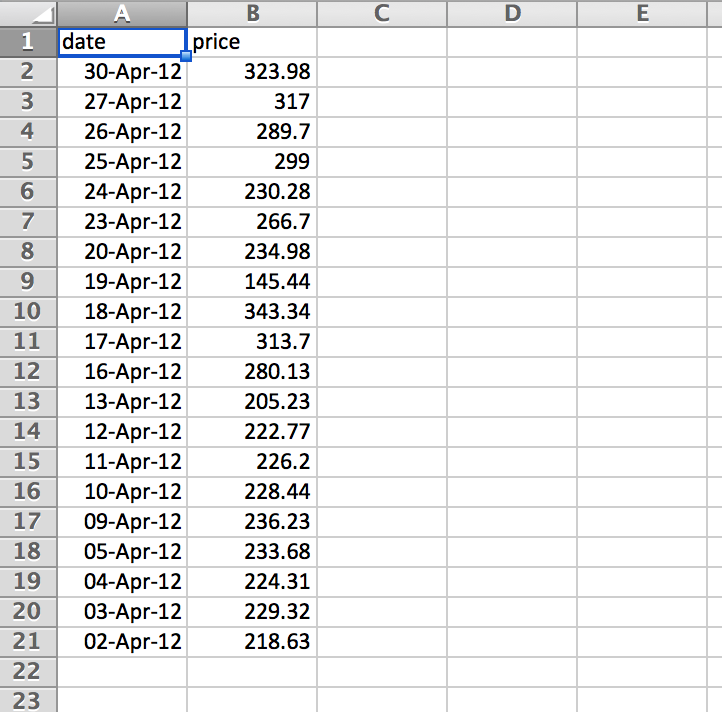
A responsive single page application is made for an interactive data table and 2 relavant graph types. A 2-column CSV file can be uploaded and dynamically loaded on the application that converts the data into graphs and table. The data in table can be edited. Graphs updates from changes to the data table. clicking on a specific graph element highlights the relevant cell in the data table.
The whole application was coded by me.
HTML5, Sass(SCSS)
Vanilla JavaScript
D3 Library